Every webmaster knows that Google Analytics provides us with very detailed and useful statistics reporting – it can answer almost every query about your sites performance. Recently, Google Analytics has added mobile reporting and now helps you to track and enhance your SEO. Combined with Dating Factory’s in house reporting suite, you can have a complete understanding about your sites’ performance.
We have discussed Google Analytics in our previous articles, so let’s take a closer look at what reporting the Dating Factory platform offers you.
1. Overview Reports
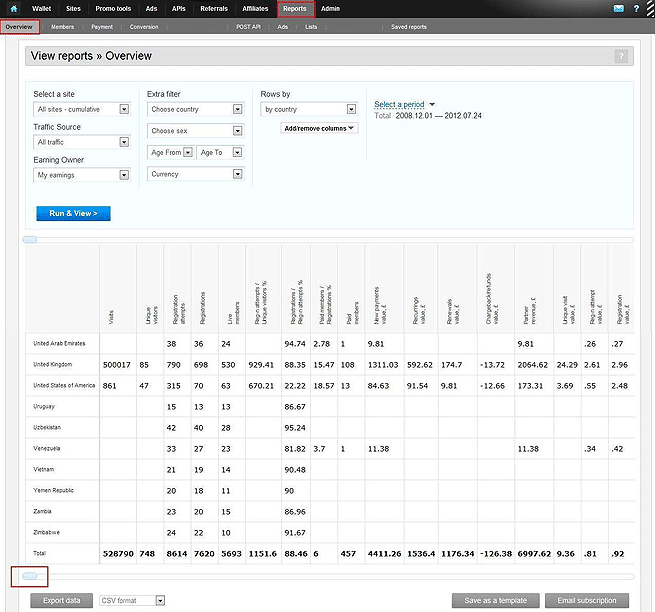
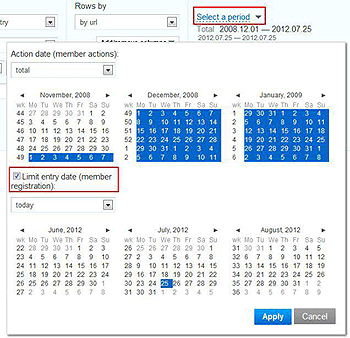
As you might know in Overview reports, we provide you with general stats of your websites. You have as many filters as possible to refine your report such as by niche markets (Senior dating, Disabled, Trans and etc.), by site or view all sites cumulative performance. Extra filters gives you even more factors to refine your report by; country, sex, age and currency. The period of time for the report is also customizable by preset dates or can be change to whatever you prefer. As well, you can limit the entry date of members to track the payments of the new members that registered within a certain period of time:
The report itself can be displayed in various ways; from the rows “by country” to such criteria as Languages, Education or even Smoking.
As an example, many of our new Partners usually find our reports very useful and a common question is, “I’ve got about 2 K unique visitors on my site but not a single registration?”
We would like to mention that as the site is set up, it is being indexed with the search engines and crawling bots. Also when you analyze the traffic on your sites by countries you can clearly see that some countries give you large volumes of unique visitors but very little live or paid members. That means that the traffic is not properly targeted and the visitors are not focused on dating sites at all. This is a typical example of how to use the reports to improve your site performance.
If it’s natural traffic then it is up to you if you want to keep it in your reports or limit it with geo filters. If you drive this traffic to your site with any kind of promotion you need to compare the cost with the member value you get and correct your promotion campaign accordingly.
Here are some more details on the most important report columns that best describe your sites performance:
- Registration attempts/Unique visitors % – the ratio of registration attempts to new unique visitors in %. It characterizes how well your landing page is working to convert visitors into registrations.
- Registrations/Registration attempts % – ratio of completed registrations to registration attempts in %. This is how many people actually confirm their emails and are able to use the sites, receive our promotion and offers.
- Paid members/Registrations % – ratio of paid members to registrations in %. This describes how well your traffic, your site and our system convert from trial to paid memberships.
- Unique visit value – how much your unique visitor is worth based on the number of new unique visitors and payments value
- Registration attempt value – how much registration attempt is worth based on the number of attempts and payments value
- Registration value , € – how much your registered member is worth based on the number of registrations and payments value
- Paid member value , € – how much your paid member is worth based on the number of paid members and payments value
2. Members Reports
These reports can give you a much better analysis on the members of your website/s, how active they are in terms of communication and content provided, direct you on what should be done to increase the retention rate and get your recurring payments higher than they currently are.
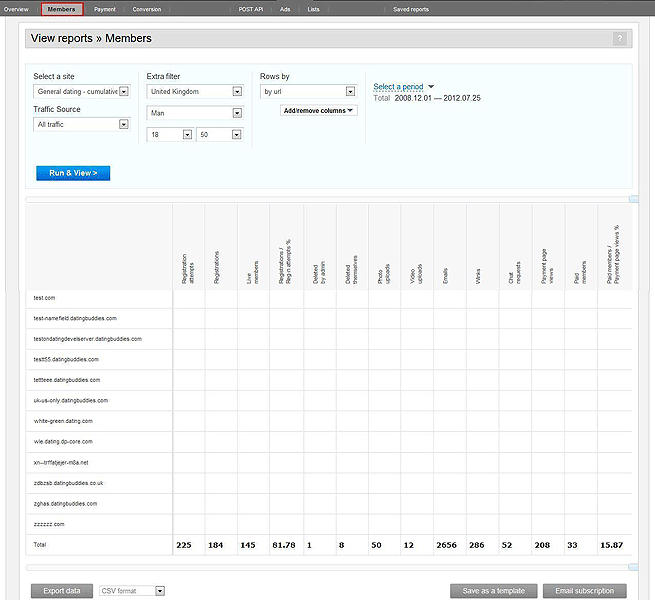
Some of the useful columns here are:
- Payments/Payment page views % – ratio of payments number to the payment page views in %. It shows how well your traffic and payment page convert to paid members.
- Deleted themselves – number of people who deleted their profiles or asked Customer support team to be deleted. This gives you some data for analysis if you need to pay more attention to your site in terms of retention. We have already given some tips in one of our previous articles.
- Deleted by admin – number of people deleted by Dating Factory moderation team. Mainly it happens due to some suspicions on fraud or skimming. This also shows the quality of traffic that you drive to your site. If this number is significant it could be a reason for you to change the traffic source.
3. Payment reports
Some of the strongest tools of the Dating Factory reporting is the ability to provide our partners with up-to-date well-structured data of the payments they get from the sites on our platform. After all, this is what we all come here for, isn’t it?
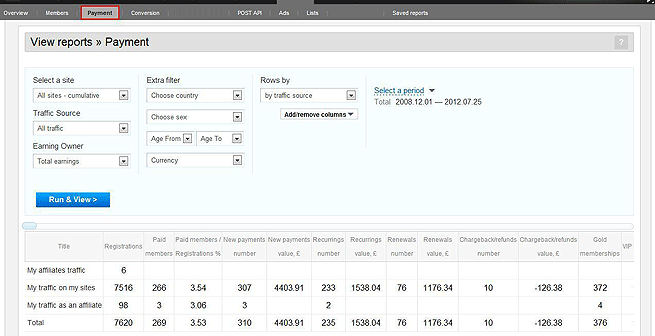
There are also some very helpful columns that you should pay attention to:
- Recurrings number – the number of recurring payments. It shows the number of members that have not cancelled the subscription and re-billed on your sites. This is an indicator of how well your members find the interesting and appealing.
- Renewals number – the number of renewal payments. It counts the members that have paid and cancelled before and then pay again on your sites. This helps prove that your newsletters and our promotion tools and offers played the role well in winning back members.
- Chargeback/refunds number – the number of chargebacks on the site. The payments cancelled that went through due to the credit card fraud and could not be stopped or disputed by us.
Note: We do our best to prevent chargebacks – as we suffer the same losses as the webmasters and site owners – and are constantly implementing various techniques to detect such fraudulent members and remove them from the platform.
4. Conversion reports
This is the most useful and dedicated report to estimate your traffic, site performance and our platform effectiveness. The conversion rates measure every stage of your members experience on the website, from their first visit to their recurring payment status are displayed. You can see and analyze the points where you could apply additional efforts to convert members as you strive for a successful and highly profitable dating site.
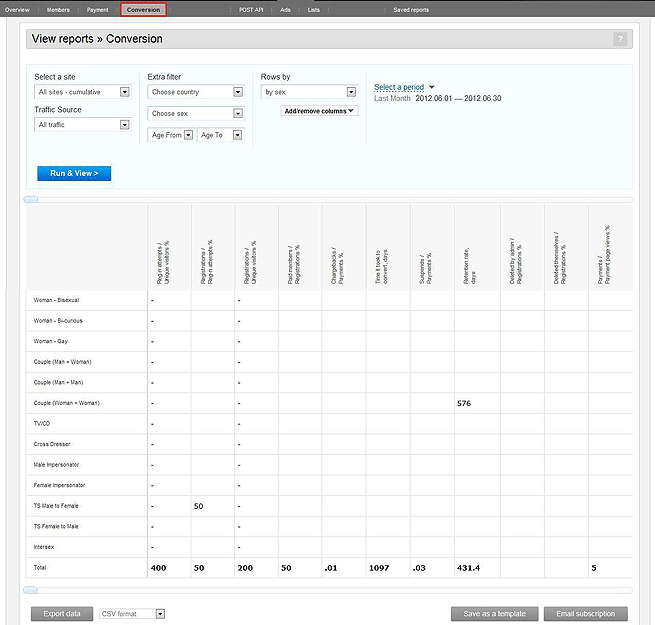
Some very useful columns for you in this report:
- Chargebacks/Payments % – ratio between the number of chargebacks and payments on your site. If this goes above 2.5% you need to rethink your advertising campaign strategy and limit the traffic from the high risk countries – ask your account manager for more details.
- Time it took to convert, days – average time how long it took your members to become paid members – from registration to payment. Dating Factory from its side performs some promotion activities to make this period as short as possible.
- Cancellations/Payments % – ratio between cancellations and payments number, also known as “Churn rate”. It characterizes how well your sites retain members.
- Deleted by admin/Registrations % – ratio between deleted by moderators and registration numbers that allows you to judge what % of your traffic is of bad quality.
- Deleted themselves/Registrations % – ratio between deleted themselves and registration numbers that allows you to judge what % of people are either not content with the sites or found their love there and deleted their profiles.
The numbers in this report are also important for the webmasters that want to participate in our Affiliate program. One of the important requirements for the site is that it needs to have good conversions both from unique visitors to live members and the Live to Paid members. These conversion rates cannot be lower than 7% and 5% correspondingly.
5. Ads reports
This section of the reporting allows you to track the efficiency of your promotion campaigns. It will appear in your Reports as soon as you set up your ad campaigns and start driving traffic to your sites.
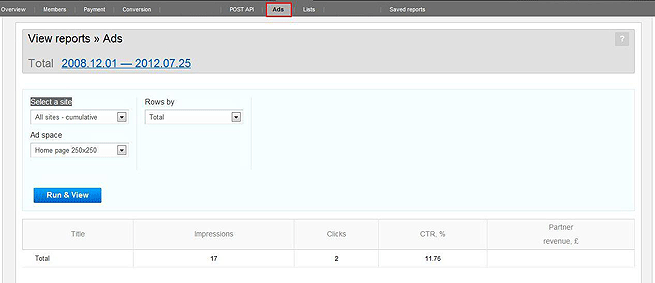
It gives you the data for analysis of the promo-tools and promotion campaigns that you used to attract visitors to your sites on the platform. This way our reports will provide you with essential feedback on the types of promotions and allow you to choose which channel or tool needs to be deleted or improved. Keep your eye on this report while calculating your marketing expenses.
6. POST API
Please note this reports section is available when you have API enabled for your account.
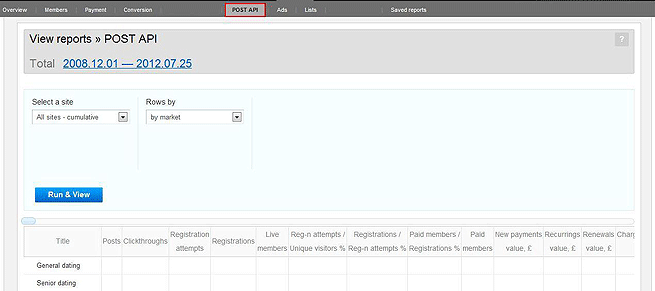
This report section helps you to keep track of the members that you posted to your sites via an enabled API. All the columns are at your disposal to receive full information on the selcted members.
7. Lists
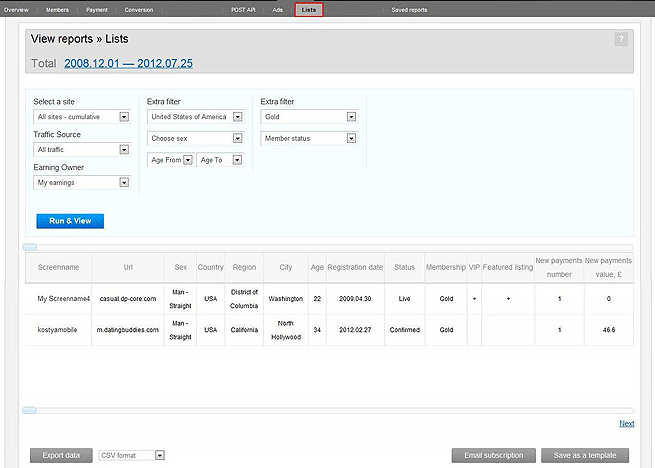
The more understanding you have about your members the easier it will be to monetize them. The Lists section of the Dating Factory reports provides you with the ability to create and analyze the lists of your sites members matching various criteria that you select.
8. Saved reports
In this section you can manage your saved reports as well as decide on which reports to receive or stop receiving by email. You can select either daily, weekly or monthly reports that you have created for your particular needs (e.g. tracking performance of special promotion campaign targeted for male members in UK, etc.)
Also, every report can be exported into MS Excel or SCV format.
The reports in general are flexible and offer profound tools for tracking both overall business performance and separate status rate down to of one of your site member’s experience. You can add or remove the columns from reports to match your unique reporting requirements.
With Dating Factory you can easily create the report that can give you all the necessary performance criteria. We hope that our efforts to create a powerful set of statistics tools at your fingertips will help you better understand your traffic, track your sites performance and succeed!